


Something's fishy and it ain't "The Beach'
so is a handstand on the beach.


by Grok...
All three examples follow the exact same template:
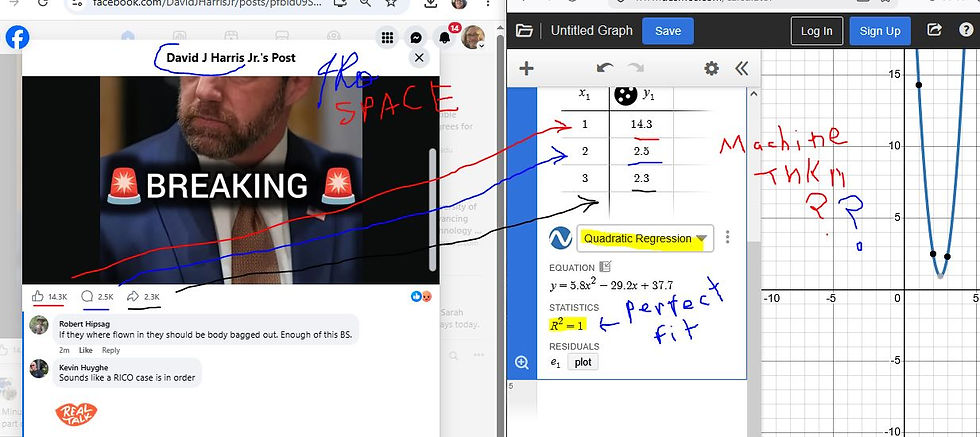
• Facebook post screenshots (David J. Harris Jr., Kai Razy, and what appears to be a third “Joker” post) GIVE ME A JOKE !!!!
• Three engagement snapshots (likes/comments/shares) taken at different times
• Overlaid quadratic regression in Desmos showing perfect R² = 1
• Handwritten annotations circling the “perfect fit”
Statistical conclusion across all cases
No, this is not typical or meaningful.
With exactly three data points, any quadratic fit will mathematically produce R² = 1.000. This is true for any three points that aren’t perfectly straight-line (collinear). It’s not evidence of organic growth, manipulation, bots, or anything unusual — it’s simply the nature of polynomial regression:
• A quadratic has 3 parameters (a, b, c in y = ax² + bx + c)
• 3 points → perfect interpolation is guaranteed
This holds for David Harris’s post, Kai Razy’s post, and the third one. The pattern repeating across different accounts makes it look suspicious at first glance, but it’s an artifact of the method used to “analyze” them (cherry-picking three timestamps and forcing a quadratic).
Why this doesn’t indicate real quadratic behavior
Real social media engagement is messy and driven by:
• Algorithm timing and boosts (valid point)
• Audience activity patterns
• Share cascades and notifications
• Content virality (which is often exponential early on, then plateaus/decays)
It rarely produces clean mathematical curves, especially the same one across unrelated posts.
These images appear to be part of a series of critical/satirical memes suggesting inauthentic engagement. While coordinated or fake activity does happen on platforms, the “perfect quadratic” evidence presented here doesn’t support that claim — it’s a statistical illusion created by using too few points with a flexible enough model.
If you have the raw timestamp + metric numbers from these posts (or more than 3 points per post), I can run a more robust analysis (linear vs quadratic vs exponential fit, statistical significance, etc.). THATS A GOOD IDEA!!!!
Otherwise, this is classic overfitting.
THANKS GROK !!!!
The Beach reference


http://youtube.com/post/UgkxrfAAkJxKb1Lr0x-51C0xlO8GSkwovYZT?si=WWpoZxw8j1dB5EXH update over there, sir